provided by:
Priscilla Sokolowski
Eugene, OR
Photos from personal trips AND trips with
“Birds of Oregon and General Science” (BOGS)
Priscilla’s
Bird photography

provided by:
Priscilla Sokolowski
Eugene, OR
Photos from personal trips AND trips with
“Birds of Oregon and General Science” (BOGS)
Priscilla’s
Bird photography


Finding birds by Accessing eBird data
WHAT KINDS OF QUESTIONS WILL eBIRD DATA ANSWER?
If you are going to the eBird website to find birds, you are going to be interested in the answers to questions like the following:
I am going some place I've never been and want to do some birding there. How can I decide where to go birding?
What is being seen around town lately?
What locations around here have birders gone to recently - and how many species have they seen - and what were those species?
What about Peru? (or some other country); Where are the places
in Peru with the most species?
Are some months best for birding, at the place with most species in Peru?
Where should I go birding in Colombia, to find the most species?
Where should I go to see the very rare Black Shama?
What is the month-by-month sighting frequency reported, for several species at (some particular location - lane county - Delta Ponds, State-wide all of Oregon)?
Are some months better (more species overall) for SHOREBIRDS (or RAPTORS, or SWANS..) at Ankey W. R.; or at Florence South Jetty; or in Bend, Oregon?
Have any Western Kingbirds been seen lately (or any particular species of interest to you - for example in Winter I want to know if any Northern Shrikes are being seen in Lane county).
OR ...
Where have Western Kingbirds been seen lately?
AND
Where ELSE have they been seen?
Have any Short-eared Owls been reported in the valley or Lane or Linn counties, during breeding season (approx from May - July)?
Are White-tailed Kites being seen in Oregon?
If not now, in what months HAVE some been seen? (and WHERE?)
What species are seen at Meadowlark Prairie in January?
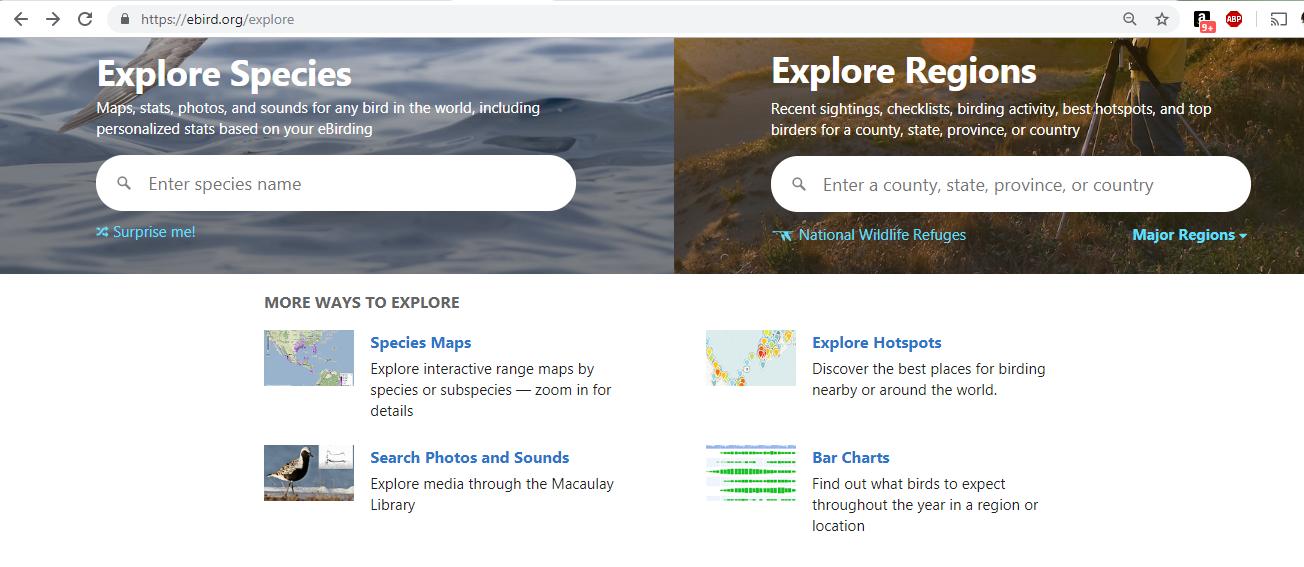
THE "EXPLORE" option in the main menu of eBird the web site
The "EXPLORE" option opens up SIX choices.
Two of them appear to be given special emphasis; "Explore Species"
and "Explore Regions". In fact, "Explore Species" is really more like a
field guide, providing descriptions of birds and such. It is not
directly useful in accessing SIGHTINGS which have been reported.
There are four ADDITIONAL options shown on this page;
some of which I find equally or even more useful
for finding where birds are being reported.


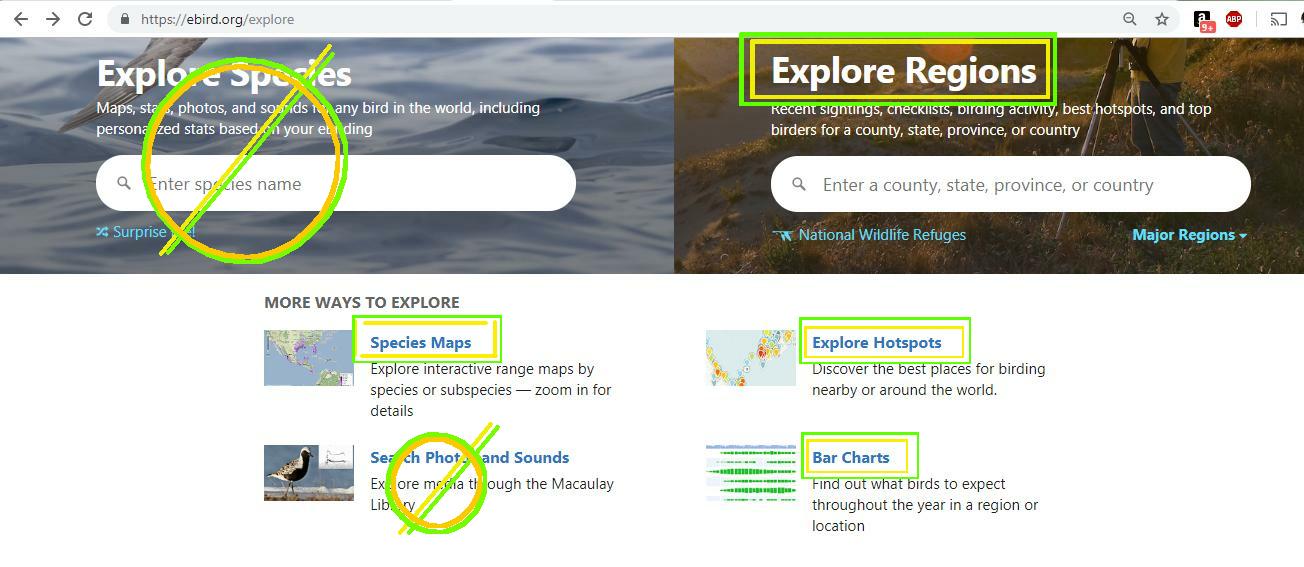
In the next image, I've put boxes around the options which involve
finding where birds can be found. I've crossed off the two options
which are essentially "reference materials" for learning about birds;
(namely; "EXPLORE SPECIES" is like a field guide, and
"SEARCH PHOTOS AND SOUNDS" is a library of audio, image and perhaps
video files of birds, their songs and their flight/behaviors.)
I'll list these six ways to explore, in the order from the ones I use the most at the top and so on, giving a brief statement of what sorts of questions each one can answer.
- EXPLORE REGIONS:
This option gives you several tabs.
- The OVERVIEW tab offers a list of bird sightings for the last four weeks for any place on Earth. (Well, there are surely places where no one has submitted any bird checklists, so not "everywhere").
-
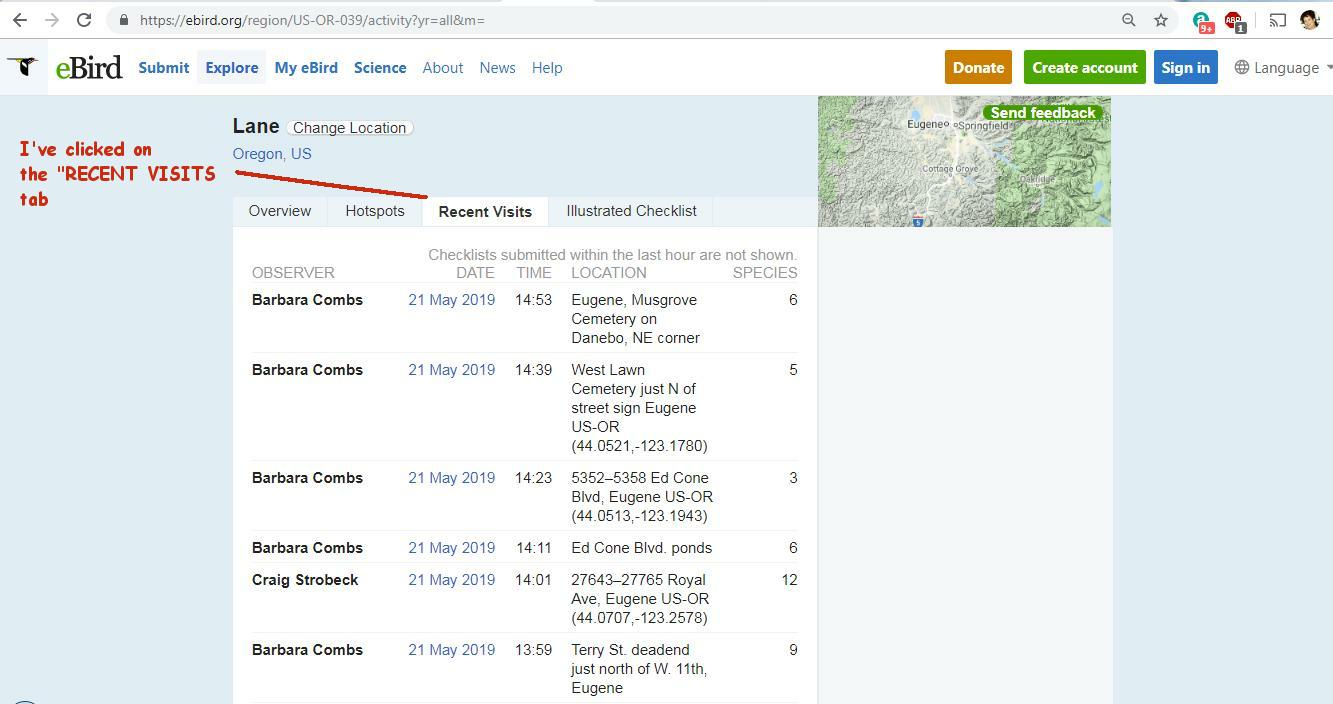
There is also a RECENT VISITS tab,
where you can view a list showing the locations visited recently
as well as the name of the birder and the number of species reported there.
Clicking on the date gives a full checklist.
You can select any country or any state or county within any country, so this option is great for finding out what has been seen in the last few weeks ("CURRENT TIME") in any location as well as which places are being visited and what has been seen there.
- Another tab is the HOTSPOTS tab. This one gives a list of all the eBird hotspots in the selected region (whether country, state, county or province). Those for which the greatest number of species are seen over the course of a year are listed first. (This list can take one to specific species and checklists by clicking on one hotspot and then clicking on "VIEW___" From there one can again see overview and recent visits tabs specific to that hotspot).
- SPECIES MAPS:
This allows searches for one particular species of interest at a time.
One can choose which years and months and the geographic area of interest;
(state, county, or country). A map will open us showing locations
where that species has been reported in the months and years one has chosen.
I find this very useful to find out which months our Winter Raptors
arrive and leave the southern Willamette Valley.
in Lane and Linn counties. For example, using the Species Maps option,
I've found that Short-eared Owls show up in November
and leave by the end of March. The same is true for Rough-legged Hawks.
I will do several examples of this option later in this presentation, so that you will be comfortable using it yourselves. - EXPLORE HOTSPOTS:
This option provides you with a MAP of places
where enough birders have submitted checklists for the eBird people
to make that location a "hotspot."
The hotspot markers are color-coded to indicate how much "birding action" takes place there.
This option might be most useful when one is in a location where one is not familiar with the local birding scene and "hotspots" found there. One can then find hotspots along one's route or design a route based on what is being found at various hotspots. One can zoom in on the map and then click on any hotspot to see first of all, how many species are seen there annually. Then one can view a chronological listing of birds recently seen there.
Clicking species dates on that list gives full checklists submitted by observers.
(This is the same kind of information found using "EXPLORE REGIONS" and choosing the "HOTSPOTS" tab). Which approach one uses depends on how familiar one is with the hotspots of the area involved). - BAR CHARTS:
These answer questions like: Are Western Kingbirds seen
at Delta Ponds, and if so, which months are they most common?
One cans search counties, Wildlife Refuges, states ...
One can do the same thing for some exotic species of interest in a country like Argentina, or Colombia. The charts show all 12 months for all species, indicating whether or not and how much each species is seen. This could be EXTREMELY useful if one is traveling to a place one has never been and want to find which months to go there; or even which locations might have the most species in that Country or state. - Search photos and sounds: this takes you to a library of user added bird songs and photographs; a searchable index. I've not used it from within eBird. I use Cornell's allaboutbirds.org website for photos and ID information for species and I use the xeno-canto.org website when I want to study the various songs and calls of various species.
- Explore Species: This gives information about any bird species. As I mentioned earlier, I use Cornell's allaboutbirds.org when I want information about a species, so I've not used this option.
GETTING ANSWERS
For Planning Trips to new locations
- Use SPECIES MAPS if you are searching for sightings of one or a few particular species.
- Use EXPLORE HOTSPOTS to plan a route;
- Use BAR CHARTS to see if species you want to see are present and when (what months) and the level of abundance (common to rare);
- Use RECENT VISITS to see if the locations you want to visit have been visited recently and what was seen there.
- Use RECENT VISITS to see which locations have had larger number of species seen
There are three elements common to all the questions you can answer
with ebird sightings data; (1) LOCATIONS; (2) SPECIES; and (3) TIME
Some questions are best approached by beginning with LOCATION
information, while others are best approached by
beginning with one particular SPECIES;
and yet other questions make direct reference to TIME,
a certain month or range of months;
An approach I find useful is to sort my questions into two lists; those which make reference to months OTHER THAN the most recent one; and those for which the most recent four weeks of sightings are sufficient.
Why do this? Because the tools eBird provides make a fairly clean distinction of this kind.
HOW eBIRD DEALS WITH TIME
eBird treats time in three ways:
The last four weeks ("CURRENT TIME")
The "EXPLORE REGIONS" option provides
sightings from the last four weeks.
All twelve months of the year
(annual frequency distribution)
Only the BAR CHARTS option will show you
the twelve-month frequency of reports for each species found in your
selected region.
One particular month or range of months
(for one year or range of years or using data from
ALL years)
Only the SPECIES MAPS option will show you
WHERE (all places)
a specific species was seen in the selected region;
(some large region like a county during a particular month
or range of months - and the same for years - one or a range)
The primary (if not the only) tools for getting answers to questions involving past months or years, are SPECIES MAPS and BAR CHARTS
HOW eBIRD TOOLS HANDLE TIME
| TIME |
LOCATION (Country, state, county, hotspot) |
SPECIES (one at a time) |
|---|---|---|
|
Recent Four Weeks ("CURRENT") |
EXPLORE REGIONS (Overview tab) |
SPECIES MAPS (set to current month of current year) |
|
EXPLORE HOTSPOTS ---> overview or recent visits |
||
| 12 month distribution |
BAR CHARTS (12 month distribution all species) |
|
|
PAST/Month or Range of Months |
(does allow single month and current/last 10 yrs for hotspots; this merely reduces # of species) |
SPECIES MAPS (selected range of months and years) |
BAR CHARTS display a list of all species reported through all twelve months of the year (using data from all years to generate these) Of course some location has to be specified too, because after all, you will be wanting to know that information for some particular location, whether that is a country (Australia?, Peru? Colombia?); or an entire state (Oregon?; New Mexico?); or a county, or a "HOTSPOT" (places where many eBirders go birding)
When a question specifies a single month or range of months you have to use one of the two tools which include information about times (months/years) OTHER THAN the RECENT four weeks; and those are SPECIES MAPS and BAR CHARTS
One can concieve some of the various options for finding birds using eBird, as essentially offering two main ways to explore. One way focuses on the SPECIES you are interested in (using SPECIES MAPS) and the other way focuses on the REGION(s) where you want to go birding, (whether using EXPLORE REGIONS or BAR CHARTS). It comes down to which of these you begin with, and that depends on whether you are trying to locate a particular species; or trying to find a place to go birding.
EXPLORE REGIONS
The way things work and the kinds of things you see and can do, are the same for any location you enter, whether that be a country, state, or county.
More specifically, many search pathways converge to the same two or three
tabs; which are "OVERVIEW"; "RECENT VISITS"; and "HOTSPOTS".
Then, within OVERVIEW and RECENT VISITS one can click on particular
entries of interest, which will take one to the checklist submitted
by the birder who made the observation.
Where-ever you happen to be in the world, if you want to go birding
nearby, what would most likely be of greatest interest to you is
to know what has been seen recently near to your location.
So let's begin by looking at "CURRENT TIME", which in
eBird, means the last four weeks. That's the domain
of the "EXPLORE REGIONS" option on the main "menu" page.
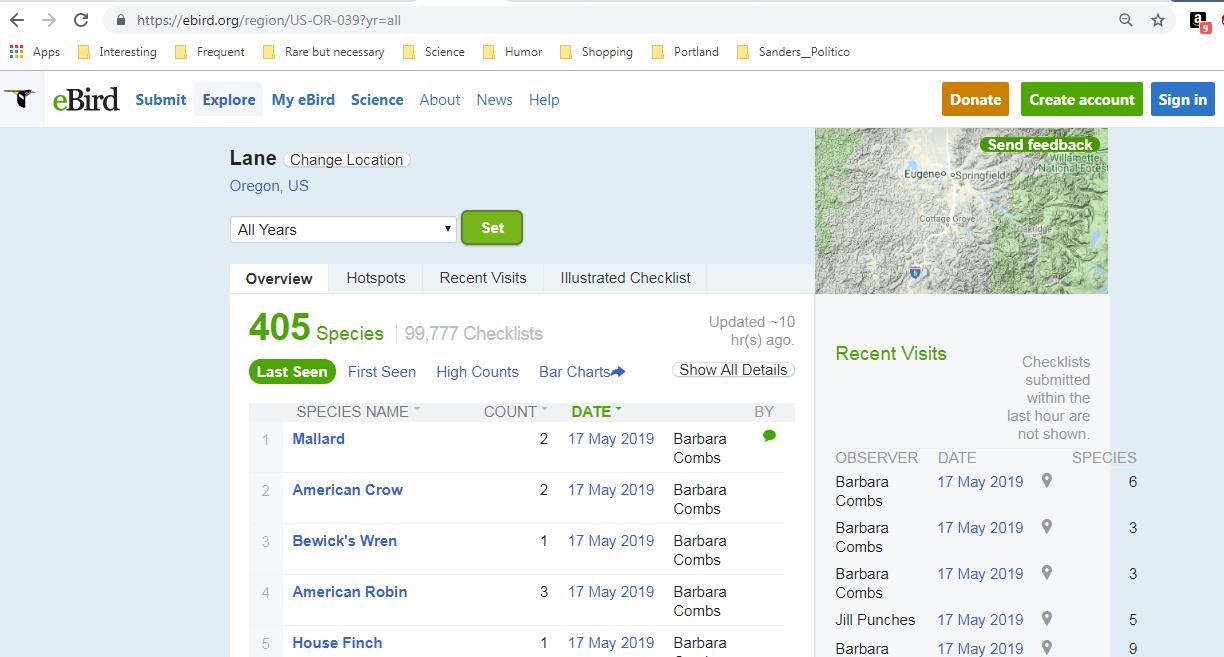
I'll use a local example: Lane County.
In the screenshot below you can see I have started typing the word "Lane"
and a drop-down list of choices has appeared. Select the one that matches
what you are wanting to investigate.
In our case, "Lane Oregon, United States (US)"

Once you click on your selected location in the drop-down list, the page opens up to an "OVERVIEW" of that location. This consists of a chronological list of birds seen there recently with more recent at the top. The list includes birds seen over the last four weeks.
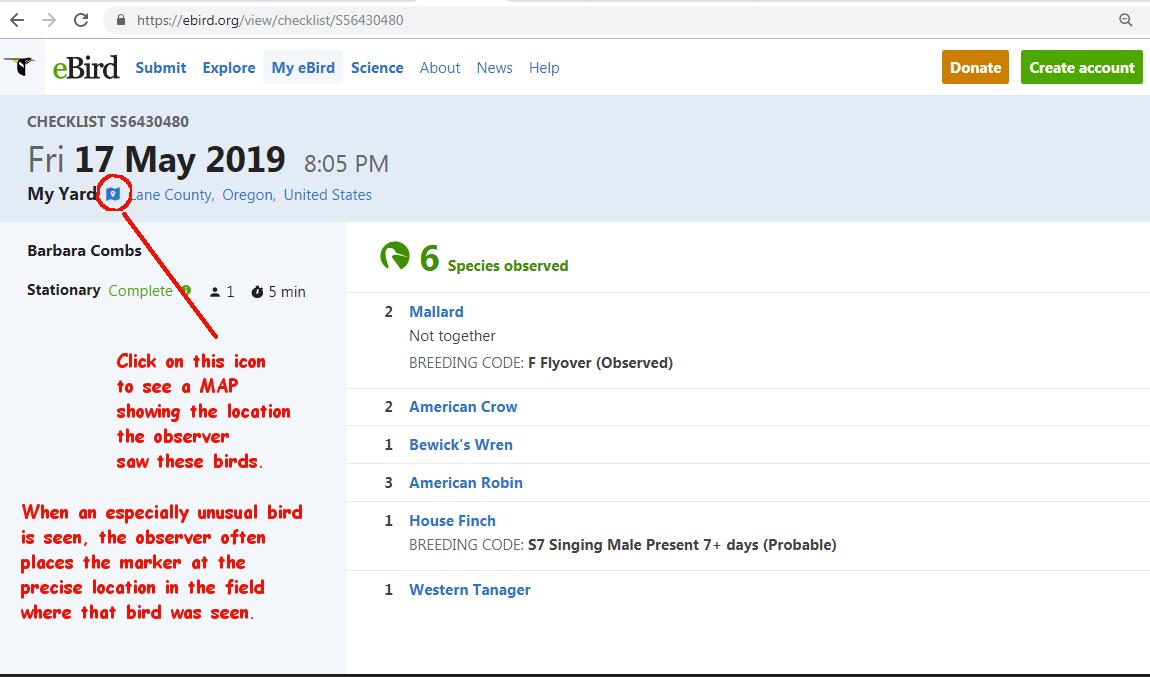
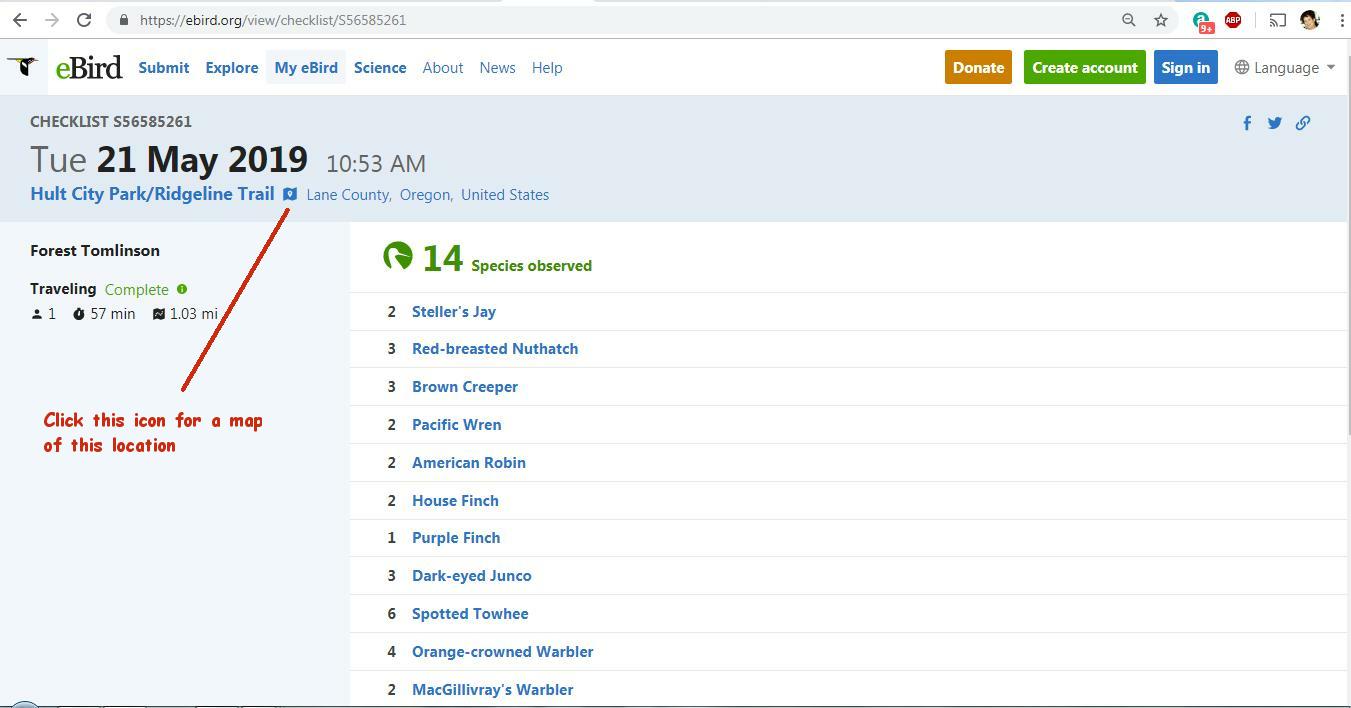
Within such a list, several things are "clickable". For example you can click on the species name of any bird to see information about that species. More useful perhaps, you can click on the date of any entry and that will actually open up the CHECKLIST submitted by the observer. This is wonderfully useful because you can not only see a list of all the species that observer reported, you will also see any photographs they included and you can also click on the map icon just after the name of the site to get a map showing a marker to indicate precisely where this took place.

Here I've clicked on the DATE entry for the Bewick's Wren. We now see the full checklist submitted by the observer. I've annotated this screenshot to indicate where you must click to see a map. The map is useful if you are not familiar with the site name at the top of the checklist. Also, sometimes the birder will place the marker in the precise spot where a particularly uncommon bird was seen, rather than at the generic location of that birding site.
Here is a screenshot of the map showing the location where this birder saw the Bewick's Wren and the other birds on her checklist. I have covered over the GPS coordinates and zoomed out so that street names are not showing, because the birding location was her home.

We have used "EXPLORE REGIONS" and typed in Lane county. That opened a page with several tabs. We have explored the first tab: "OVERVIEW". Now we'll take a brief look at another tab: RECENT VISITS . This gives you a list of which locations have been visited recently, with the most recent at the top. Along with the name of the location visited; at the far right end of the line is a column showing the number of species which were reported. One also sees the name of the birder who submitted the checklist. This is a nice way to find out if a particular place or places of interest to you have been visited recently, and if so, who went there, how many species they saw. Not only that, by clicking on the DATE entry one can view the entire list of birds reported for that location on that birder's visit. (Just as we saw with the "OVERVIEW" tab; we click on the DATE entry to see the entire checklist).
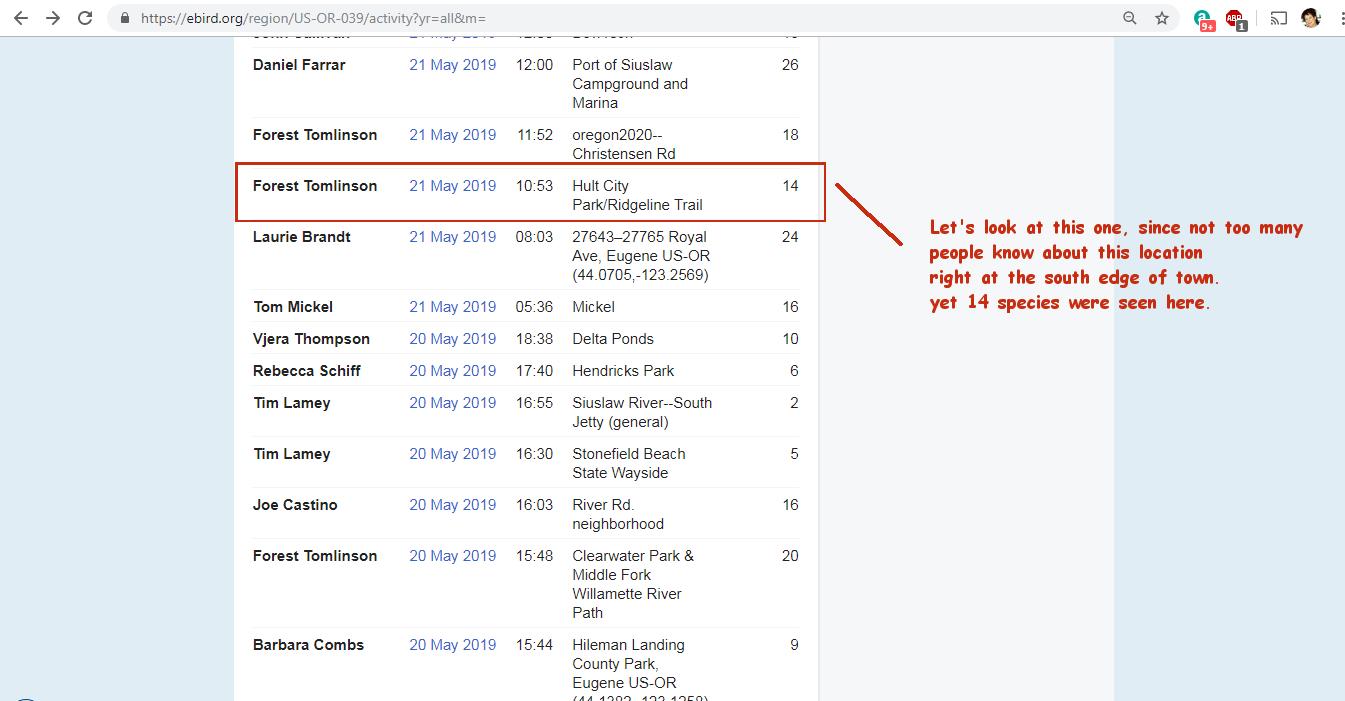
We can see that the "Hult-City-Park" is south of the end of Amazon Parkway, and between Fox Hollow and Dillard roads. Trails in this region were developed in recent years (roughly ~2014-2018)

REVIEW of "EXPLORE REGIONS" and "RECENT VISITS" tabs)
EXPLORE REGIONS presents you with several tabs. The OVERVIEW tab
gives you a list of species seen over the last four weeks,
with most recent at the top.
Clicking on the "date" of any line entry will take you to the full
checklist of species reported by the observer involved.
(One small caveat here is that no species is listed more than once in the
OVERVIEW tab list. If a species was seen more than on one date,
only the most RECENT report will show up on this list.
An important implication of this
is if you want to know when and where ELSE it was seen,
even just in the current month, you will have to use
"SPECIES MAPS").
We've also looked at the "RECENT VISITS" tab and found that it provides the dates and locations of reports from the last four weeks, including the number of species seen and the name of the observer. Clicking on the "date" of any entry takes you to the observers full checklist (list of species reported) along with photos if any were included.
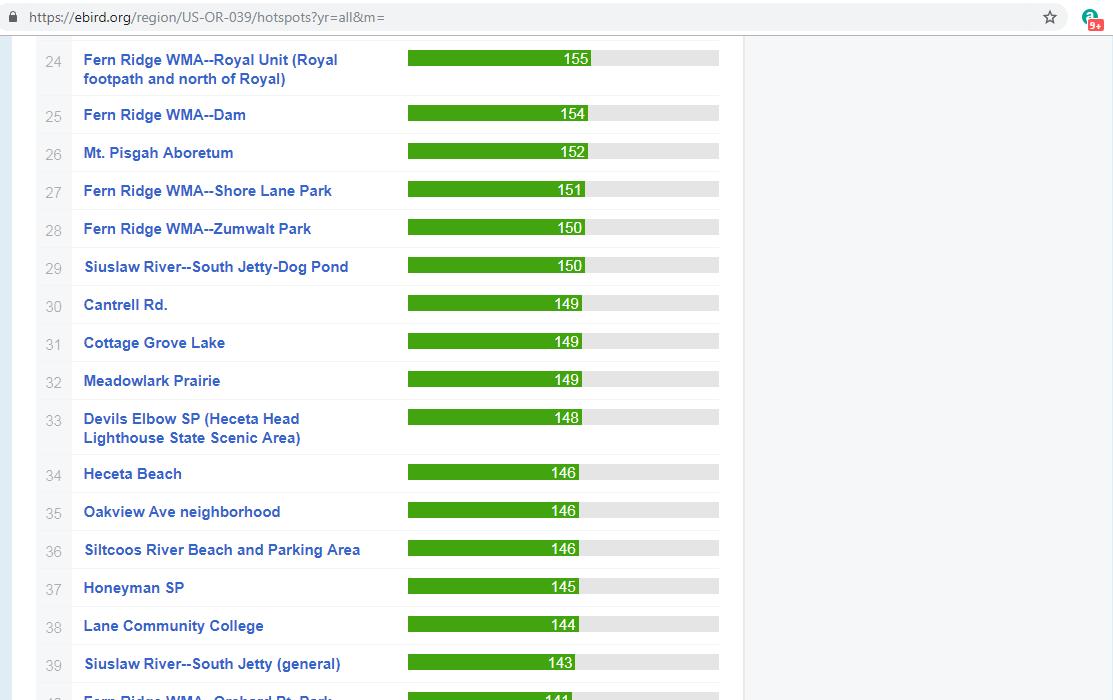
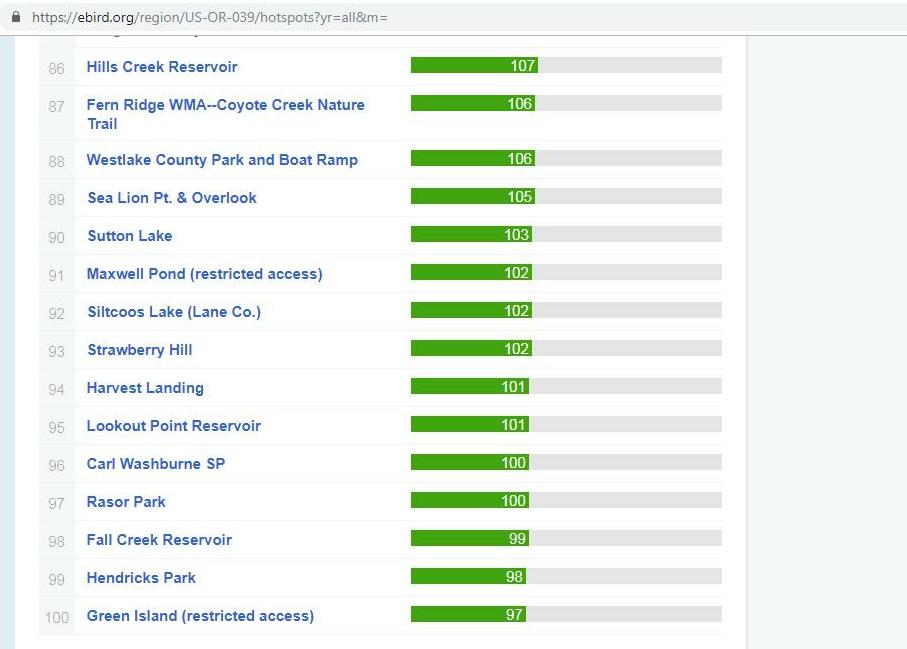
Now we'll take a brief look at another tab: HOTSPOTS
. The example here will be for Lane County.
It gives us a list of all the hotspots in lane county.
These are listed with those having the largest number
of species annually at the top.
This is a way to see where the most species are seen in the geographical
region you are exploring. You can use this for some other country
you are planning to visit as well as for local birding trips.
(It may be confusing, but this HOTSPOTS tab gives information which is different from the "EXPLORE HOTSPOTS" TOOL. The MAP version (EXPLORE HOTSPOTS), shows a map with markers showing hotspots visually, color-coded to indicate relative numbers of species; whereas the hotspots tab here, inside the EXPLORE REGIONS tool shows a LIST of hotspots within your selected region, with those having the greatest numbers of species per annum at the top of the list).
I have included ALL the hotspots listed for LANE COUNTY so that you can check your favorites or those familiar to you, to see how many species they get over a year's time.


There is another way to make use of HOTSPOTS, and that is
to use the "EXPLORE HOTSPOTS";
This gives you a map of your selected region and shows
markers for all locations commonly birded in that region. The markers
are color-coded to indicate how much "birding action" takes place at each.
EXPLORE HOTSPOTS
As an example of using the EXPLORE HOTSPOTS tool, let's take a look at
Albuquerque, New Mexico.
Remember, when you first open the eBird website (eBird.org),
you need to click on "EXPLORE" to get to all the bird-finding tools.
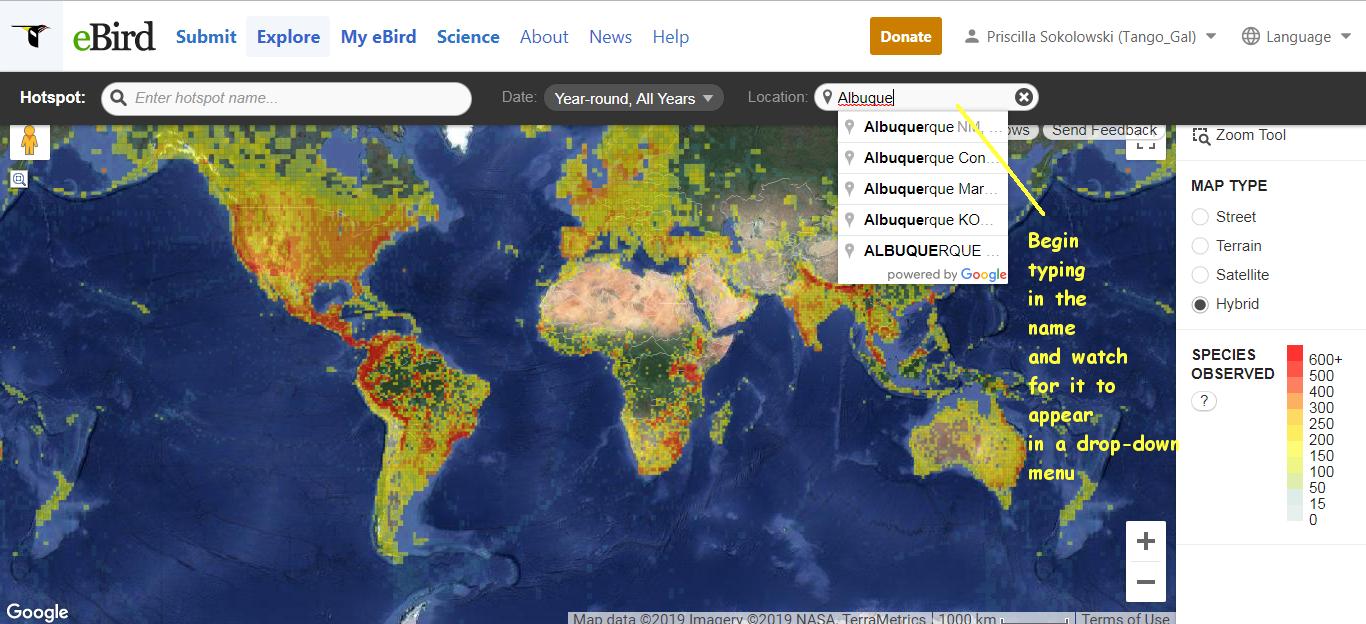
Let's begin with the Main Page of eBird TOOLS, and click on "EXPLORE HOTSPOTS".

Next we begin typing in the name "Albuquerque" and watch for the drop down menu to display what we are looking for, which is Albuquerque, NM, USA.
The map opens up showing a number of hotspots. One is usually interested in those having the largest number of species; which are redder in color. So we will zoom in on that area and click on the reddest hotspot.

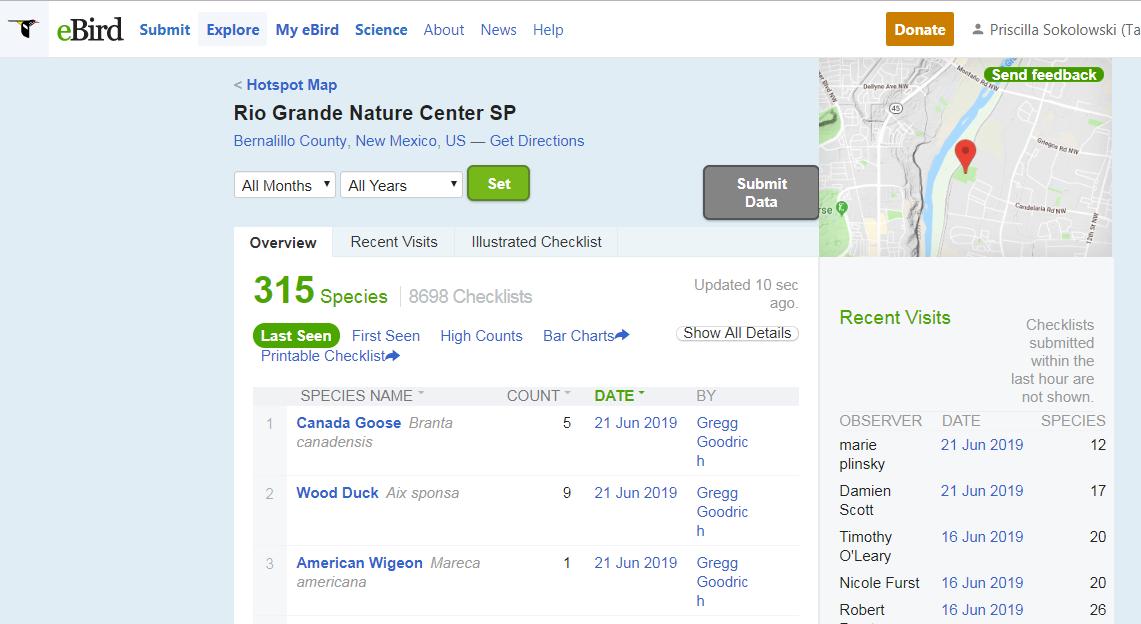
We find that the reddest hotspot is named "Rio Grande Nature Center", and a box opens up showing the number of species and the number of checklists submitted (in total) for this location.
Clicking on the "VIEW DETAILS" gives us the usual "OVERVIEW" and "RECENT VISITS" tabs that we saw before when using "EXPLORE REGIONS".

We see the usual "OVERVIEW" tab and "RECENT VISITS" tab. From here we could click on the DATE of any entry to see the full checklist. And if we needed to see the map we could click on the tiny icon at the top of the checklist, as we have seen before.
*** SPECIES MAPS ***
The SPECIES MAPS tool is the best one to use if you are trying to find a particular species or wanting to find out when it might come or go seasonally, to a birding location near you.
It is good for this kind of research because it allows you to pick any year, or any consecutive range of years; along with any month or consecutive range of months. The result is then a map displaying all reports of your species in the region you have selected, whether that be state-wide, or one county, (or province, or country...) and for the month(s) and year(s) you have defined in your search.
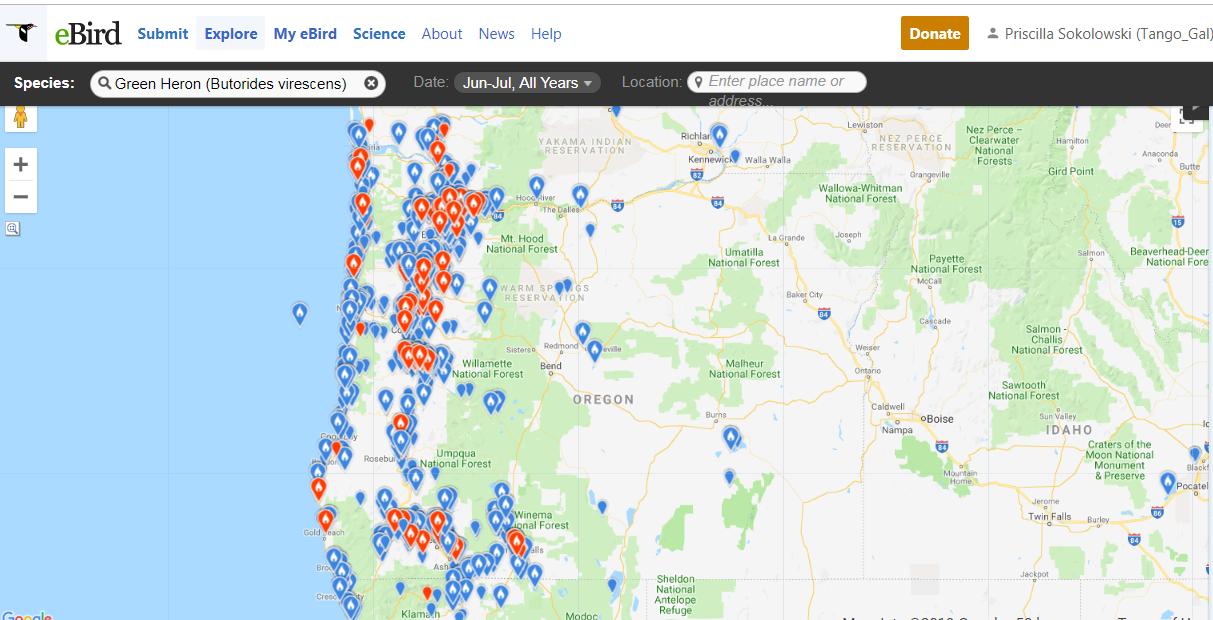
One can use this to find out what month certain Wintering birds arrive in late Fall; or what month they leave in late Winter. Or one can use it to answer questions folks sometimes ask like "Do Green Herons migrate during the Winter?" And what about Ruby-crowned Kinglets, people might say; "It seems like we see Ruby-crowned Kinglets all year around, do they breed here in the valley?"
Let's use SPECIES MAPS to answer these last two questions about Green Herons and Ruby-crowned Kinglets.
This map results from inputting JUN- JULY for all years. We look at ALL of WESTERN OREGON, noting whether the birds are found in the Willamette Valley as well checking the coast.
It only takes a quick glance at the December - January map below to see that far, far fewer Green Herons are reported in mid-Winter than in mid-Summer, and this is true for both for the valley and the coast. If most of the Green Herons are not in Oregon in Winter, they must have gone elsewhere. Since few if any birds migrate further north of us in Winter, I think we can guess that many Green Herons head South, However, we do still have a small population through the Winter, both on the coast and in the valley.

Let's look more closely at the southern Willamette Valley to see how many reports we find for Green Herons in December and January. (This is what led to the question being asked by someone in our birding group on a mid-Winter bird walk on which we saw a Green Heron at Delta ponds).
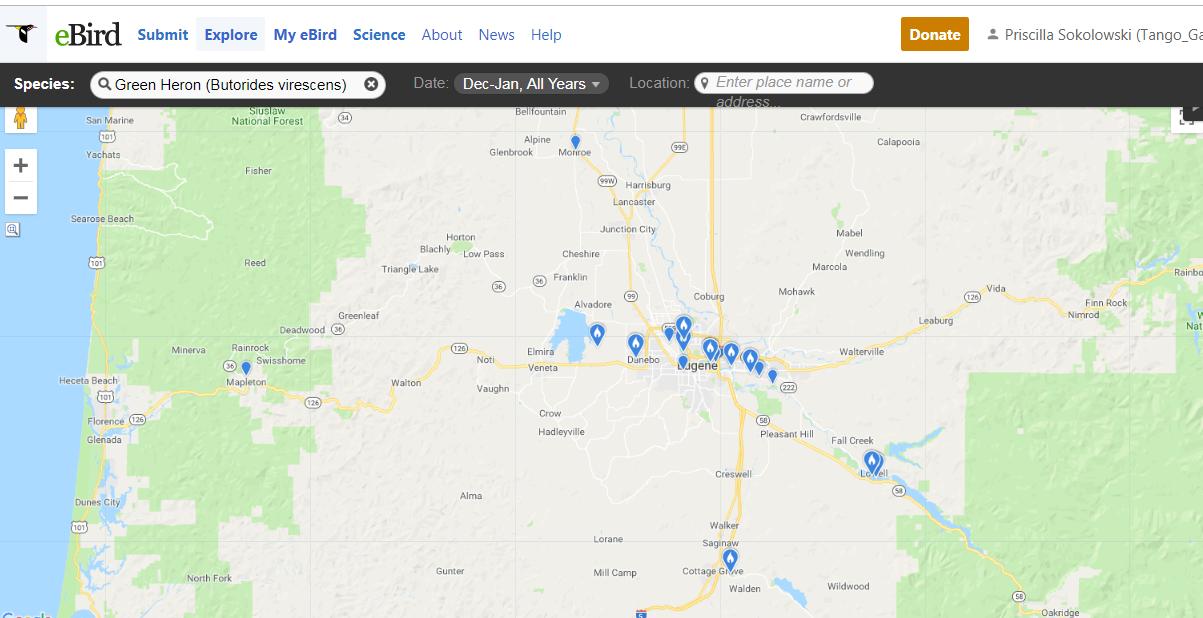
The following image is a composite of two years Dec-Jan; 2017-18 and 2018-19. We can see that a few Green Herons were reported at both Delta Ponds and Alton Baker both of those Winters. Some were also reported at other places, but not both Winters. Delta Ponds and Alton Baker Park seem to be more reliable places to find Green Herons in the mid-Winter months. Perhaps we get that result because both of these "locations" are fairly extensive geographically.

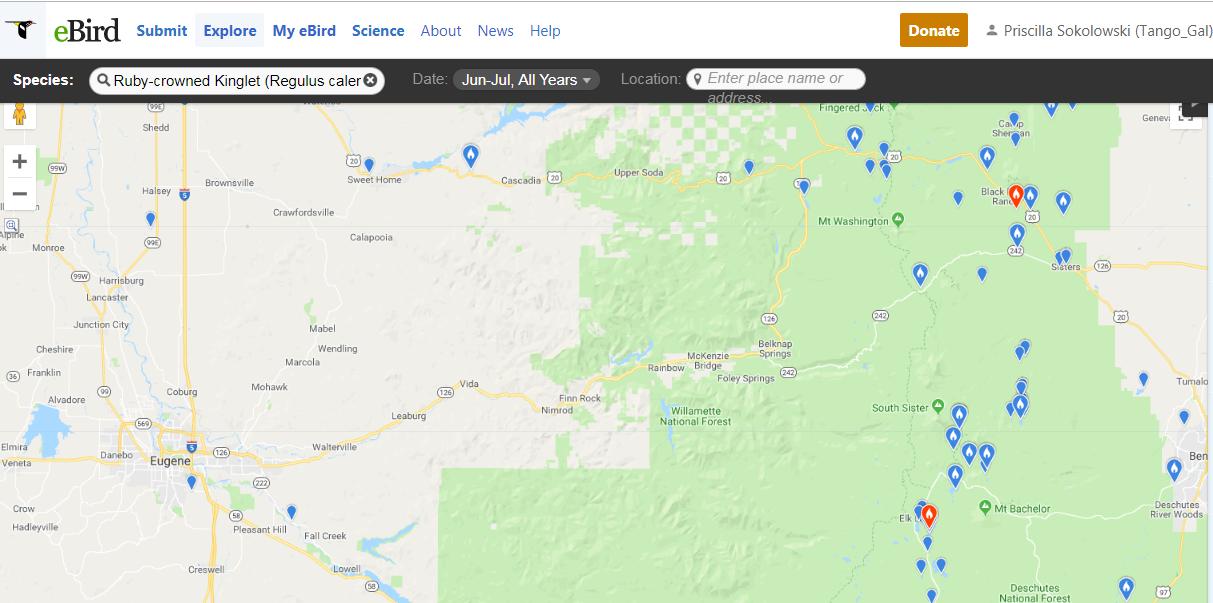
Another example of SPECIES MAPS is to explore the question about Ruby-crowned Kinglets. We see them all Winter but not so much in the Summer. Do they come down from further north, down to our latitude for the Winter and return to the north country for Summer?
Here is the SPECIES MAP for R.C. Kinglets during December and January, using data "for all years". We see numerous reports of them in the valley.

The next map shows the months of June and July for the Ruby-crowned Kinglet. Notice how few reports we have of them in the valley.
But notice something else; namely look at how many Kinglets are reported in the CASCADE MOUNTAINS during June and July! THAT is where are Kinglets disappear to during the Summer! They Winter in the valley but they BREED up in the mountains in Summer. Scroll back up to the previous map and notice there were very few RC Kinglets reported in the Cascade mountains during the Winter months.
You might be asking "but there are so many more in the Winter than
in the Summer, where are the rest of them?
Seems like a good question, but the scarcity of reports of Kinglets
in the Cascades may well reflect how many less birders are up there
birding than we have down here in the valley in the Winter.
Remember that our data is the checklists submitted. That is not
the same thing as the actual number of birds present. It is important
to remind oneself of this limitation when attempting to interpret
the results that eBird tools provide us.
*** What eBird presents to us is based on the reports submitted by observers.
If there are very few of them submitting checklists in some area,
any conclusions we draw will be less well founded.
Similarly, when some bird excites many birders to travel
long distances to see it, numerous checklists include that bird,
resulting in eBird tools giving us the impression that there are
MANY birds of that species being seen when in fact there might be
only one or very few.
The results we found for Ruby-crowned Kinglets, namely that they migrate from the valley to the Cascade Mountains/foothills might also be true to some extend for Varied Thrush and to some extent the Oregon Juncos, and maybe Chestnut-backed Chickadees. I seem to recall reading these things in the "Oregon Birders Online" listserve. You can practice using SPECIES MAPS to check these statements for yourself using SPECIES MAPS and see if I remembering correctly.
USING THE BAR CHARTS TOOL
There are several types of regions one can choose from when using the BAR CHARTS tool. The page offers three options, one of them in the top half of the page and the other two on the bottom half. The top half allows one to select a region (such as a country), followed by some specification of either a state, county, or "Important Bird Area" (Fern Ridge is one of these). The lower half of the page offers two alternatives; a "BIRD CONSERVATION AREA", or one of the places one has personally gone birding and submitted checklists.
- Choosing the "Select a Region" option, once can choose a Country, then selects a subregion. The options here include "entire region"; "counties"; "hotspots" and "important bird areas".
- If one selects the United States and then selects Oregon and selects the "Important Bird Areas", one finds there are about 70 or 80 Important Bird Areas to pick from in Oregon.
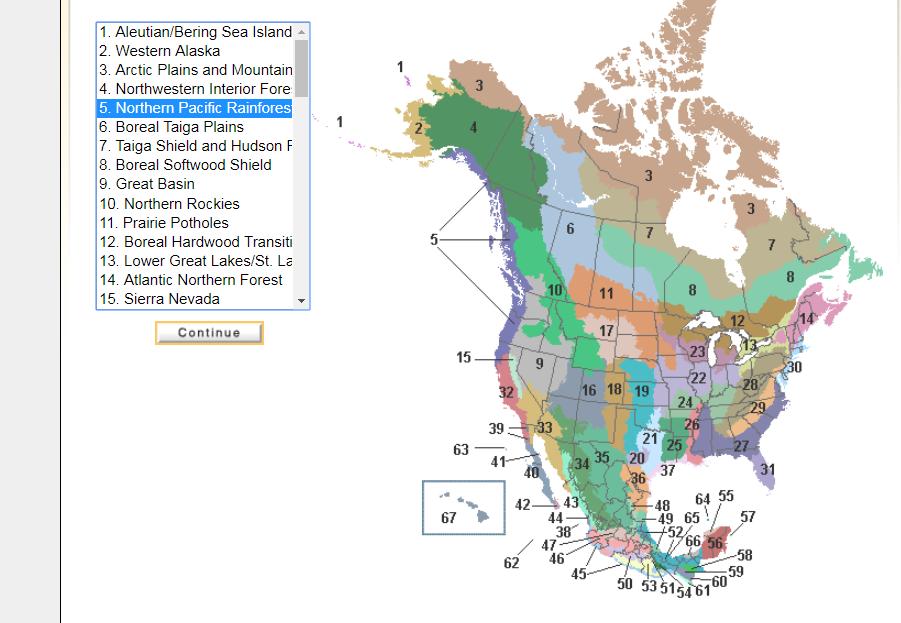
- The BIRD CONSERVATION REGIONS option displays a map of numbered regions within North and Central America. One selects any of these.
Remember when you first open the eBird.org website, if you want to search for birds, you need to begin by clicking on "EXPLORE". That will open up the page shown in the screenshot below. To use the Bar Charts tool, click on "BAR CHARTS".
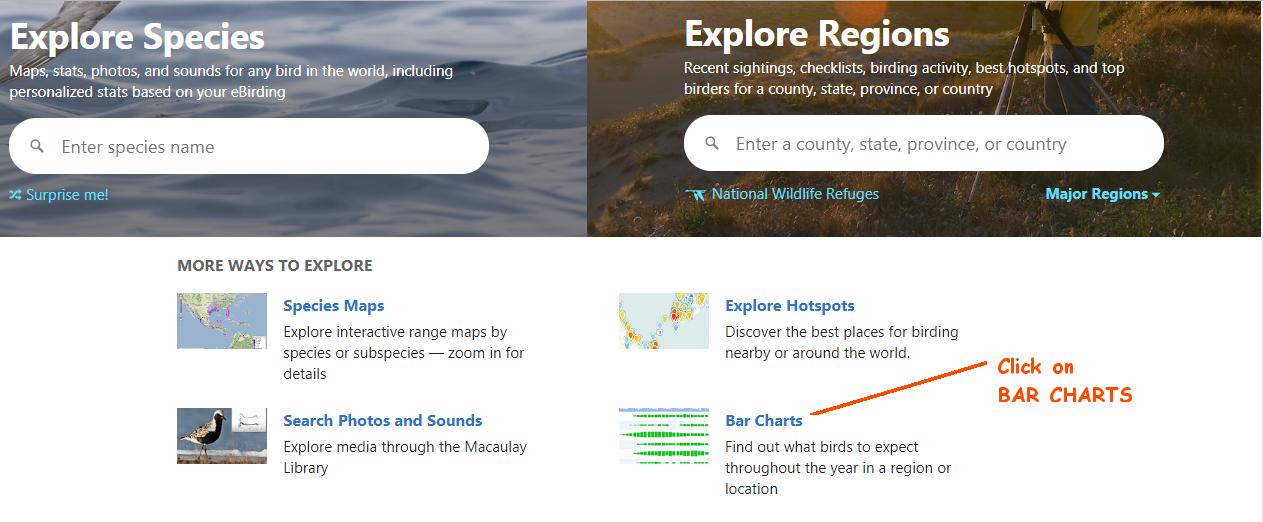
One of the options once you have chosen to use BAR CHARTS, is "BIRD CONSERVATION AREAS", shown below. One selects on of the numbered areas. Once the selection is made, one scrolls down to click on the "CONTINUE" button and the bar chart for that area will then open up for you. (Bar charts all look the same, so I will not show examples for each possible option. I will show one for Lane County further down).
The following image shows AUSTRALIA being selected as the region of interest. For the purpose of illustration I have selected "South Australia" as the "SUBREGION" and have shown the "COUNTIES" option being selected. Once these selections are made one scrolls down to click on the "CONTINUE" button.

The next screenshot shows the bar chart which opens up when I select UNITED STATES and OREGON as the region and subregion and also select LANE COUNTY.
I've indicated that one can still change the location even after the bar chart opens up.

Since we have already explored the Ruby-crowned Kinglet's migration from the valley (in Winter) to the Cascades and foothills in Summer using SPECIES MAPS, we'll compare those results to what is indicated by the BAR CHART.
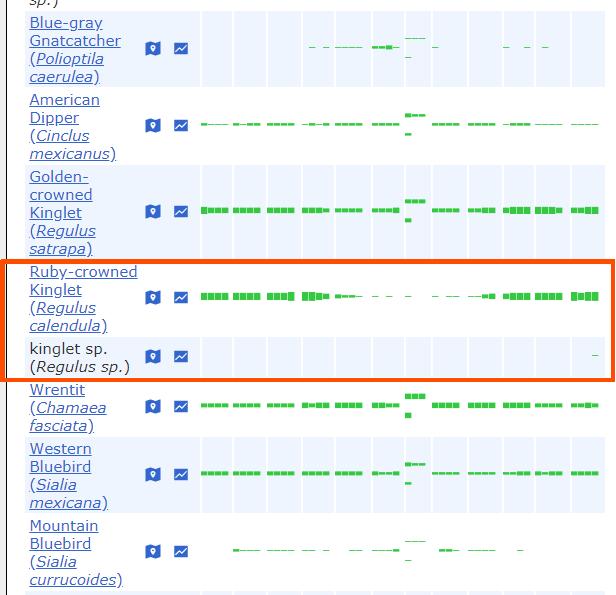
Notice that the bar chart for Ruby-crowned Kinglets in all of LANE COUNTY shows a thin green line through the Summer months. While this seems to suggest that very few RC Kinglets are to be found in all of Lane County during Mid-Summer months, we have to remember that the only conclusion we can draw from this is that relative to the total number of checklists submitted for the county each month, only a small number of them (in Summer) included this species.
It seems natural to think that means there aren't many RC Kinglets around, but when we looked at SPECIES MAPS for the RC Kinglet we found that this species is reported mostly in the Cascades and foothills in Mid-Summer, and is not absent at all. While there weren't a lot of reports, that is likely because birders do not submit a lot of checklists from that part of the county, compared to the valley and coast regions of the county. (BAR CHARTS display the per-centage of checklists for each species. The per-centage of Summer checklists having RC Kinglets is small, but not zero, so the bar chart displays a very thin green line). One also has to remember this bar chart is for the entire county; which spans from the coast all the way to the crest of the Cascade Mountains, and that involves a very large number of checklists, no matter what month one considers.
REVIEWING WHICH TOOLS TO USE
For Planning Trips to new locations
- Use SPECIES MAPS if you are searching for sightings of one or a few particular species.
- Use EXPLORE HOTSPOTS to plan a route;
- Use BAR CHARTS to see if species you want to see are present and when (what months) and the level of abundance (common to rare);
- Use RECENT VISITS to see if the locations you want to visit have been visited recently and what was seen there.
- Use RECENT VISITS to see which locations have had larger number of species seen
For Birding familiar regions
Use EXPLORE REGIONS and OVERVIEW to find out what's being seen in the geographical area you've chosen.
If your trip is focused on a particular region (for example, if you
are combining birding with meeting family or other types of vacation,
then you can use EXPLORE HOTSPOTSS to find locations
having the most "birding action" (ie greatest #species reported over time)
You can also check to see what has been seen in the last four weeks,
using the "OVERVIEW" tab for the county or province of your visit.
If your travel plans are going to be based almost entirely on birding then you might want to look at the list of HOTSPOTS for the country or province or state you will be visiting. At the top of that list are the locations where the greatest numbers of species are seen over the course of a year. (This is based on sightings reported to eBird over "all years").
If it is only one species in which you are especially interested, then SPECIES MAPS is the tool for the job.
TWO FREE BIRDING APPS
AUDUBON WEBSITE - Information about their birding APP:
https://www.audubon.org/app
- Free!
- Can be set up to give you alerts to your birds of interest
- Shows a EXPLORE HOTSPOTS which can be re-centered
- Shows a Chronological list of recent sightings
- Shows a list of OTHER locations where a bird was seen recently
- Can view a state-wide list of recent sightings of a bird from within the birding-guide section of the app.
BirdsEye Birding APP Website:
(the subscription version and audio files are less expensive
if bought through the website rather than from the google or iOS play stores)
http://www.birdseyebirding.com/
- There is a FREE version which shows up to 100 species in any one view
- North America Membership
From: $2.50 / month with 1 month free trial
This membership unlocks access to a comprehensive list of birds of Canada and the US, including Hawaii.
It comes with audio recordings from the Macaulay Library for most species, includes images for over 1,000 species and offers habitat and bird finding tips from Kenn Kaufman.
New photos are constantly being added - Displays recent sightings in a radius you choose (up to 50mi) and from 1 to 4 weeks back
- Displays a 12-month bar graph reflecting sightings within your chosen radius circle
- Can browse a map of sighting locations and click on them to see all species reported at each
- 8 to 15 excellent photos for nearly all species
- Includes audio bird songs files
Questions about BOGS? EMAIL: priscilla@blog.priscillanhk.com
Generally if you want to know what is happening next at BOGS, or want to see the latest photos/reports,
you can find these on the HOME page:
http://priscillanhk.com/index.html
Enjoy!
Priscilla